MAHINDRA MANULIFE MID CAP FUND
(Mid Cap Fund – An open ended equity scheme
predominantly investing in mid cap stocks)
 |
 |
 |
 |
 |
| Data as on 29th, February 2024 |
||||
| Investment Objective | The investment objective of the Scheme is to seek to generate long term capital appreciation & provide long-term growth opportunities by investing in a portfolio constituted of equity & equity related securities and derivatives predominantly in mid cap companies. However, there can be no assurance that the investment objective of the Scheme will be achieved. |
| Fund Features | Selection of focused sustainable businesses from across sectors
Potential to generate higher risk adjusted returns in the long term
Active management of portfolio with primary investments in mid-caps |
| Fund Manager and Experience | Fund Manager : Mr. Abhinav Khandelwal Total Experience: 14 years Experience in managing this fund: 2 years and 1 month (Managing since February 1, 2022) Fund Manager : Mr. Manish Lodha Total Experience: 23 years Experience in managing this fund: 3 years and 2 months (Managing since December 21, 2020) |
| Date of allotment | January 30, 2018 |
| Benchmark | Nifty Midcap 150 TRI |
| Options | IDCW (IDCW Option will have IDCW
Reinvestment (D) & IDCW Payout facility) and
Growth (D) D-Default |
| Minimum Application Amount | Rs. 1,000 and in multiples of Re. 1/-
thereafter |
| Minimum Additional Purchase Amount: | Rs. 1,000 and in multiples of Re. 1/- thereafter |
| Minimum Repurchase Amount: | Rs. 1,000/- or 100 units or account balance, whichever is lower |
| SIP | Minimum Weekly & Monthly SIP Amount: Rs 500 and in multiples of Re 1 thereafter Minimum Weekly & Monthly SIP Installments: 6 Minimum Quarterly SIP Amount: Rs 1,500 and in multiples of Re 1 thereafter Minimum Quarterly SIP installments: 4 |
| Monthly AAUM as on February 29, 2024 (Rs. in Cr.): | 2,129.99 |
| Monthly AUM as on February 29, 2024 (Rs. in Cr.): | 2,152.78 |
| Total Expense Ratio1 as on February 29, 2024: |
Regular Plan: 1.99% Direct Plan: 0.48% 1Includes additional expenses charged in terms of Regulation 52 (6A) (b) and 52 (6A)(c) of SEBI (Mutual Funds) Regulations, 1996 and Goods and Services Tax. |
| Load Structure: | Entry Load: N.A. Exit Load: An Exit Load of 1% is payable if Units are redeemed / switched-out upto 3 months from the date of allotment; Nil if Units are redeemed / switched-out after 3 months from the date of allotment. |
| Portfolio Turnover Ratio (Last 1 year): | 0.96 |
| Standard Deviation: | 14.77% |
| Beta: | 0.94 |
| Sharpe Ratio#: | 1.28 |
| Jenson’s Alpha : | 0.0583 |
| #Risk-free rate assumed to be 6.80% (MIBOR as on 29-02-24) -
Source:www.mmda.org Note: As per AMFI guidelines for factsheet, the ratios are calculated based on month rolling returns for last 3 years. Data as on February 29, 2024 |
|
| NAV/Unit | Regular Plan (In Rs.) |
Direct Plan (In Rs.) |
| IDCW | 23.3988 |
26.2994 |
| Growth | 27.4435 |
30.4440 |
| IDCW: Income Distribution cum Capital Withdrawal | ||
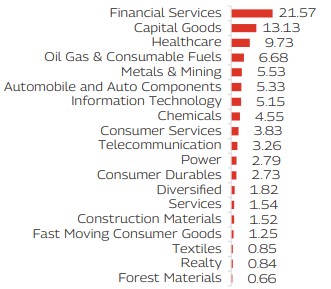
Issuer |
% of Net Assets |
||
|---|---|---|---|
| Automobile and Auto Components | 5.33% |
||
| Minda Corporation Limited | 1.83% |
||
| Schaeffler India Limited | 1.30% |
||
| Apollo Tyres Limited | 1.24% |
||
| Balkrishna Industries Limited | 0.72% |
||
| ZF Commercial Vehicle Control Systems India Limited | 0.24% |
||
| Capital Goods | 13.13% |
||
| Hindustan Aeronautics Limited | 2.01% |
||
| Bharat Heavy Electricals Limited | 1.57% |
||
| Apar Industries Limited | 1.45% |
||
| AIA Engineering Limited | 1.35% |
||
| CG Power and Industrial Solutions Limited | 1.04% |
||
| Escorts Kubota Limited | 0.98% |
||
| Grindwell Norton Limited | 0.97% |
||
| Kaynes Technology India Limited | 0.92% |
||
| Bharat Forge Limited | 0.91% |
||
| Kirloskar Oil Engines Limited | 0.79% |
||
| Lakshmi Machine Works Limited | 0.70% |
||
| Suzlon Energy Limited | 0.42% |
||
| Chemicals | 4.55% |
||
| Gujarat Fluorochemicals Limited | 1.42% |
||
| Deepak Nitrite Limited | 1.39% |
||
| Aarti Industries Limited | 0.88% |
||
| Solar Industries India Limited | 0.86% |
||
| Construction Materials | 1.52% |
||
| Dalmia Bharat Limited | 1.52% |
||
| Consumer Durables | 2.73% |
||
| Voltas Limited | 1.50% |
||
| Dixon Technologies (India) Limited | 1.23% |
||
| Consumer Services | 3.83% |
||
| Zomato Limited | 1.61% |
||
| Aditya Birla Fashion and Retail Limited | 1.26% |
||
| Vedant Fashions Limited | 0.96% |
||
| Diversified | 1.82% |
||
| Godrej Industries Limited | 1.82% |
||
| Fast Moving Consumer Goods | 1.25% |
||
| Emami Limited | 0.80% |
||
| Triveni Engineering & Industries Limited | 0.46% |
||
| Financial Services | 21.57% |
||
 |
REC Limited | 2.99% |
|
|
Union Bank of India | 2.79% |
|
|
Indian Bank | 2.49% |
|
| LIC Housing Finance Limited | 1.96% |
||
| Piramal Enterprises Limited | 1.91% |
||
| Nippon Life India Asset Management Limited | 1.82% |
||
| CRISIL Limited | 1.71% |
||
| Max Financial Services Limited | 1.64% |
||
| L&T Finance Holdings Limited | 1.56% |
||
| The Federal Bank Limited | 1.40% |
||
| Power Finance Corporation Limited | 1.30% |
||
| Forest Materials | 0.66% |
||
| Century Textiles & Industries Limited | 0.66% |
||
| Healthcare | 9.73% |
||
|
Lupin Limited | 2.64% |
|
|
Max Healthcare Institute Limited | 2.41% |
|
|
Zydus Lifesciences Limited | 2.28% |
|
| Aurobindo Pharma Limited | 0.96% |
||
| Gland Pharma Limited | 0.81% |
||
| Biocon Limited | 0.64% |
||
| Information Technology | 5.15% |
||
|
Persistent Systems Limited | 2.11% |
|
| MphasiS Limited | 1.58% |
||
| Coforge Limited | 1.46% |
||
| Metals & Mining | 5.53% |
||
| NMDC Limited | 1.89% |
||
| Jindal Stainless Limited | 1.55% |
||
| Jindal Steel & Power Limited | 1.53% |
||
| Steel Authority of India Limited | 0.56% |
||
| Oil Gas & Consumable Fuels | 6.68% |
||
|
Hindustan Petroleum Corporation Limited | 2.37% |
|
|
Oil India Limited | 2.28% |
|
| Coal India Limited | 2.03% |
||
| Power | 2.79% |
||
| NLC India Limited | 1.00% |
||
| NHPC Limited | 0.94% |
||
| CESC Limited | 0.84% |
||
| Realty | 0.84% |
||
| Oberoi Realty Limited | 0.84% |
||
| Services | 1.54% |
||
| Container Corporation of India Limited | 1.54% |
||
| Telecommunication | 3.26% |
||
|
Indus Towers Limited | 3.26% |
|
| Textiles | 0.85% |
||
| Page Industries Limited | 0.85% |
||
| Equity and Equity Related Total | 92.74% |
||
| Cash & Other Receivables | 7.26% |
||
| Grand Total | 100.00% |
||
( Top Ten Holdings - Issuer wise) as on February 29, 2024) |
|||
| Mahindra Manulife Mid Cap Fund | CAGR Returns (%) |
Value of Investment of Rs. 10,000* |
NAV / Index Value (as on February 29, 2024) |
||||||
| Managed by Mr. Abhinav Khandelwal & Mr. Manish Lodha | 1 Year |
3 Years |
5 Years |
Since Inception |
1 Year |
3 Years |
5 Years |
Since Inception |
|
| Regular Plan - Growth Option | 59.23 |
27.57 |
24.95 |
18.05 |
15,943 |
20,800 |
30,497 |
27,444 |
27.4435 |
| Direct Plan - Growth Option | 61.67 |
29.67 |
26.99 |
20.08 |
16,188 |
21,851 |
33,070 |
30,444 |
30.4440 |
| Nifty Midcap 150 TRI^ | 57.08 |
27.42 |
25.42 |
17.09 |
15,728 |
20,727 |
31,070 |
26,117 |
22,451.13 |
| Nifty 50 TRI^^ | 28.40 |
16.12 |
16.64 |
13.35 |
12,849 |
15,675 |
21,603 |
21,437 |
32,360.25 |
^Benchmark ^^Additional Benchmark. CAGR – Compounded Annual Growth Rate. Inception/Allotment date: 30-Jan-18.
Past performance may or may not be sustained in future and should not be used as a basis of comparison with other investments. Since inception returns of the scheme is calculated on face value of Rs. 10 invested at inception. The performance details provided above are of
Growth Option under Regular and Direct Plan. Different Plans i.e Regular Plan and Direct Plan under the scheme has different expense structure. *Based on standard investment of Rs. 10,000 made at the beginning of the relevant period. Mr. Abhinav Khandelwal is managing this fund since
February 1, 2022. Mr. Manish Lodha is managing this fund since December 21, 2020. and For performance details of other schemes managed by the Fund Manager(s), please click here | Best Viewed in Landscape mode
| Mahindra Manulife Mid Cap Fund | Regular Plan |
Direct Plan |
Nifty Midcap 150 TRI^ |
Nifty 50 Index TRI^^ |
|||||
| SIP Investment Period | Total Amount Invested (  ) ) |
Market Value ( ) |
CAGR Returns (%) |
Market Value ( ) |
CAGR Returns (%) |
Market Value ( ) |
CAGR Returns (%) |
Market Value ( ) |
CAGR Returns (%) |
| 1 Year | 120,000 |
155,906 |
60.02 |
157,270 |
62.46 |
153,968 |
56.58 |
137,805 |
28.73 |
| 3 Years | 360,000 |
556,199 |
30.46 |
571,245 |
32.48 |
555,133 |
30.31 |
459,743 |
16.58 |
| 5 Years | 600,000 |
1,249,910 |
29.89 |
1,312,460 |
31.96 |
1,278,284 |
30.84 |
949,177 |
18.42 |
| Since Inception | 730,000 |
1,626,125 |
26.27 |
1,725,229 |
28.25 |
1,651,892 |
26.80 |
1,232,049 |
17.07 |
^Benchmark ^^Additional Benchmark. CAGR – Compounded Annual Growth Rate. Inception/Allotment date: 30-Jan-18. Past performance may or may not be sustained in future and should not be used as a basis of comparison with other investments. Returns greater than 1 year period are compounded annualized. For SIP returns, monthly investment of equal amounts invested on the 1st business day of every month has been considered. CAGR Returns (%) are computed after accounting for the cash flow by using the XIRR method (investment internal rate of return). For SIP Performance please click here | Best Viewed in Landscape mode
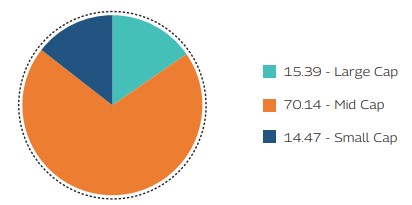
As per the latest Market Capitalisation data provided by AMFI (In line with the applicable SEBI guidelines)
Record Date |
Plan(s) / Option(s) |
IDCW |
Face Value |
Cum-IDCW NAV |
(Rs. per unit) |
(Rs. per unit) |
(Rs. per unit) |
||
17-Sep-21 |
Regular IDCW |
0.50 |
10 |
16.8352 |
17-Sep-21 |
Direct IDCW |
0.50 |
10 |
17.9362 |
17-Mar-22 |
Regular IDCW |
1.00 |
10 |
15.8458 |
17-Mar-22 |
Direct IDCW |
1.00 |
10 |
17.0649 |
27-Feb-23 |
Regular IDCW |
1.00 |
10 |
15.9686 |
27-Feb-23 |
Direct IDCW |
1.00 |
10 |
17.5623 |
Pursuant to payment of IDCW, the NAV of the IDCW Option(s) of the Scheme/Plan(s) falls to the extent of payout and statutory levy, if any. Past performance may or may not be sustained in future and should not be used as a basis for comparison with other investments. For complete list of IDCWs, visit www.mahindramanulife.com.
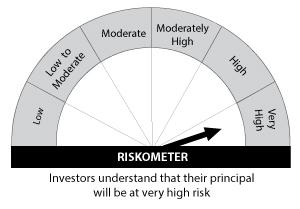
Product Suitability
|
|
| This Product is Suitable for investors who are seeking* | |
|
|
Scheme Riskometers |
Benchmark Riskometers |
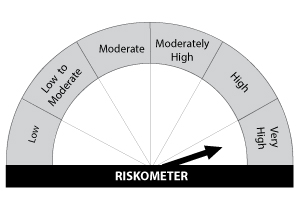 Scheme Benchmark: Nifty Midcap 150 TRI |
|
* Investors should consult their financial advisers if in doubt about whether the product is suitable for them. |
|